Archives
June 2024
Categories
All
|
Back to Blog
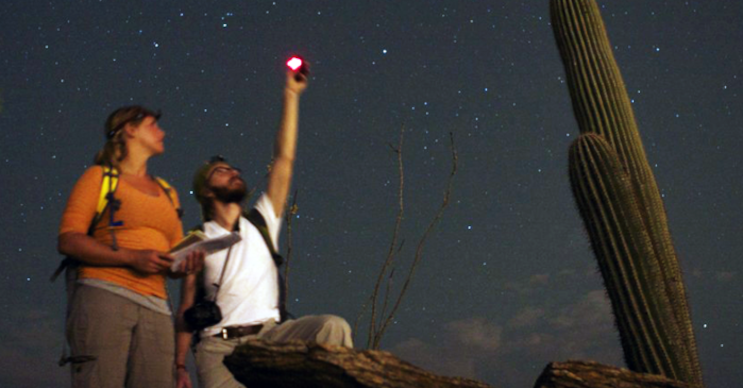
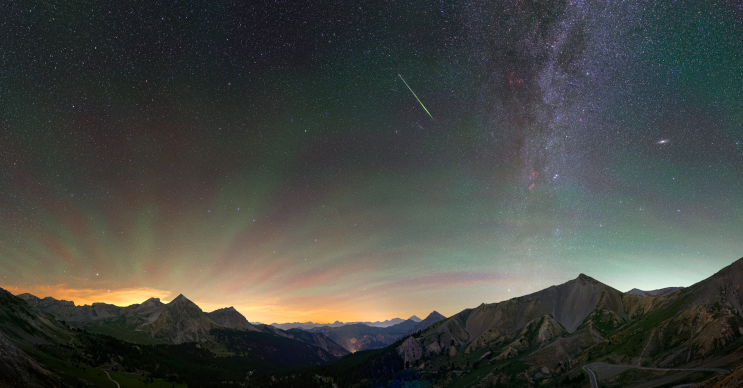
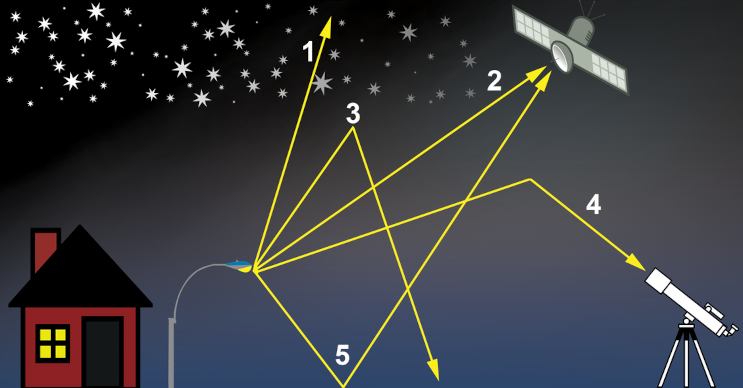
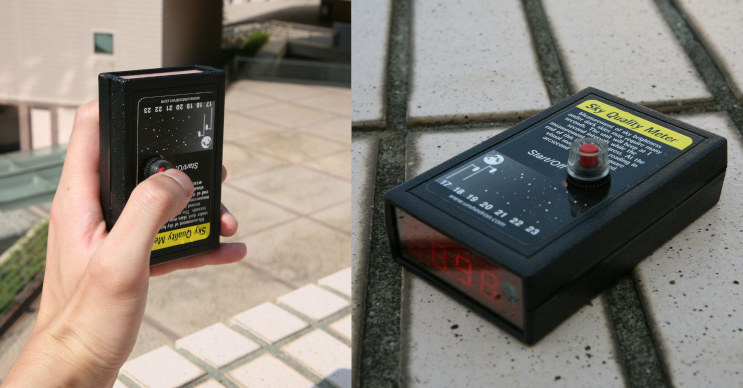
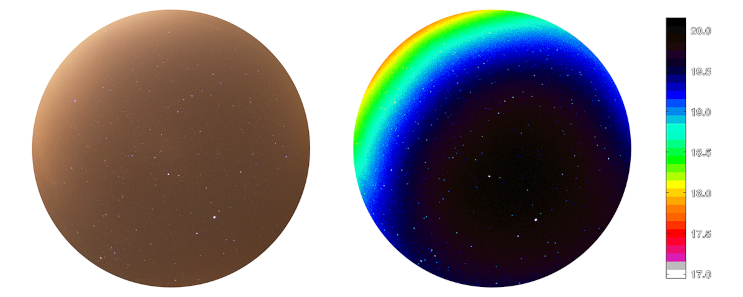
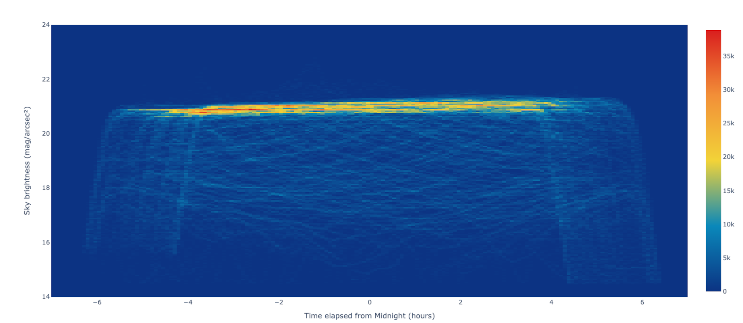
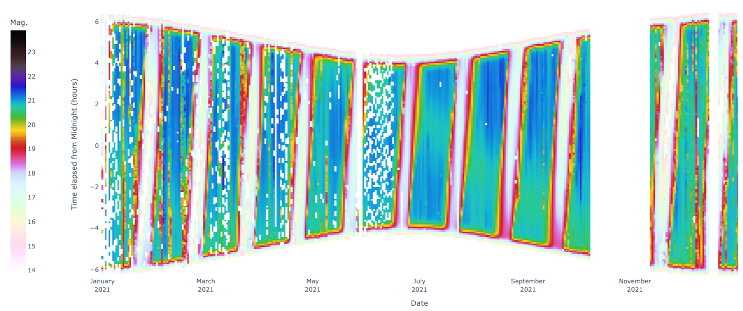
Image credit: Jeremy White/U.S. National Park Service 1290 words / 6-minute read Many of us have heard of "light pollution", but we don't know much about it. For the most part, we associate it with the phenomenon called skyglow, which is the tendency of city lights to make it difficult to see the stars at night. In turn, skyglow tells us something about the amount of light at night we're using on the ground. So if we want to reduce light pollution, we should ask how to go about measuring skyglow. We can not only track the degradation of the night sky but also the evolution of light on the ground by measuring the brightness of the night sky. Almost 50 years have passed since the last major scholarly review of the causes of night sky brightness and the methods used to measure it. Our new Nature Astronomy review paper presents the latest version of our understanding and brings this science up to date. This month's post summarizes the most important parts of the paper. The light of the night sky"Night" is the condition referring to the side of the Earth that faces into the shadow cast by our planet, blocking sunlight. Because our planet has an atmosphere, night doesn't begin as soon as the sun sets, nor does it end exactly as the sun rises. Instead, after sunset and before sunrise an observer experiences "twilight". During this time, the atmosphere scatters sunlight toward the shadow and lights up the sky. Only when the Earth has rotated far enough into the shadow, as seen from an observer's location, does night properly begin. We say that the night is "dark", but what do we mean? Most people think of a sky that is black, with stars, planets and the Moon superimposed on it. But there's more to it than that. Light from myriad stars in the Milky Way blends together and forms a bright band across the sky. Dust in our Solar System scatters sunlight toward the night side of Earth. In the polar regions, the aurora lights up the sky often during times when solar activity is high. Peering deeper with telescopes, we find even more light from distant galaxies and other sources. Under ideal conditions, the sky is never as black as it is when seen from outer space. The night sky over the Provence-Alpes-Côte d'Azur region in southeastern France as seen from the Col de l'Izoard mountain pass. Stripes of red and green night airglow merge with orange-colored skyglow from the nearby city of Briançon behind the mountain peaks at left. Credit: Maxime Oudoux / CC BY-NC-SA 2.0. An example unfamiliar to most people is the "night airglow". This faint emission of light can happen on any night and is the result of physics and chemistry of atoms and molecules in the upper atmosphere. In photos like the one above it appears as an eerie green or red glow, sometimes showing a ripple pattern across the sky. Its visibility relates in part to the Sun's ultraviolet light shining on the daytime side of the planet. But unlike the aurora, observers may see it anywhere on the Earth at night. These are all natural sources of light, but "skyglow" is something caused by human activity. In particular, wasted outdoor light causes it. As seen in the diagram below, rays of light emitted by outdoor light fixtures scatter and reflect from many surfaces. Some of those rays moving upward into the atmosphere scatter back down to the ground and make it difficult to see the stars beyond. This cartoon shows some different paths taken by light rays from outdoor light fixtures. The streetlight emits light in many different directions. Some of the light rays (“1″) are directed up into the sky and travel completely through Earth’s atmosphere. Of these rays, a few (“2″) will be detected by satellites as they pass over the nighttime side of our planet. In still other cases (“3”), rays are scattered back to the ground by dust particles or molecules in the atmosphere, forming skyglow. Some downward-scattered rays (“4”) make it into astronomers’ telescopes, effectively blocking their view of the universe. Occasionally, rays directed downward (“5”) reflect off the ground into the sky, where they might escape the atmosphere and be detected by satellites. Credit: International Dark-Sky Association Professional astronomers have collected data about skyglow for decades. But in recent years, advances in technology have enabled anyone interested in light pollution to make meaningful measurements. Equipment and methodsThere are several ways to sense the light of the night sky, from human eyes to cameras. The main differences among them relate to the amount of the sky sensed at once. The equipment we use to measure night sky brightness (NSB) falls into two broad categories: sensors that use either one or many light detectors. "Single-channel" detectors use simple electronics to record the amount of light falling on a piece of semiconductor material. The best known of these is the "Sky Quality Meter" (SQM), an inexpensive device that is easy to use. It yields high-quality measurements and is portable, needing the power of only a single 9-Volt battery. Versions of the SQM and other devices are available that users can install permanently for long-term monitoring. The Sky Quality Meter, a simple, portable electronic device for measuring the brightness of the night sky. Credit: Globe at Night "Multi-channel" sensors are often some variety of digital camera. They use many light sensors packed into a small area to resolve the night sky in two dimensions. The human eye works in a similar way, with retinal cells standing in for the electronic sensors of cameras. Human observers recording the faintest visible star make a measurement that is a kind of proxy for NSB. Cameras give more quantitative information over large swathes of the night sky. The cost of such equipment has come down considerably in recent years. With a little training and inexpensive equipment, anyone can contribute data with clear scientific value. The image on the left shows a view of the night sky from the San Xavier del Bac mission southwest of Tucson, AZ, taken on the night of 23 May 2017. The zenith (top of the sky) is at the center and the horizon runs around the edge; north is at the top and east on the left. Warm tones in the image indicate the color of skyglow then dominated by high-pressure sodium lighting emissions. False colors in the version of the same image on the right correspond to brightness according to the color bar on the right. Moving from center to the upper-left edge of the circle is equivalent to looking toward the city; as skyglow becomes more intense near the horizon, the brighter skies are indicated with the colors. Depending on the kind of sensor and lens involved, users can measure either the brightness of a small part of the sky or the entire sky at once. Different types of measurements record different information. For example, in any particular location, the main concern may be the growing skyglow influence of a nearby city. In such a case, it may make the most sense to measure only a small part of the night sky. Interpreting the measurementsOnce the data is in hand, what can we learn from it? The answer depends on how many measurements are available. Often, only one or a few observations are available from a given place on a single night. One might describe these situations as "impressionistic" measurements. They provided a limited amount of information, yet they enable people to draw some very general conclusions. As in most situations, when it comes to NSB data "more is better". The real power of NSB measurement and monitoring comes when many hundreds or thousands of data points are available. With dozens or more measurements, simple descriptive statistics can tell us a lot. These are numbers like the mean (or average) value, the median value, the high/low values, and the scatter (standard deviation) of the measurements. As the number of measurements increases, these statistics become more certain. In cases where data taken over many months or years is in hand, we can take the analysis further. Complex representations can tell us a lot about how NSB changes both from night to night as well as over many years. Two examples of this appear below: the so-called "jellyfish" plot, and the heatmap. Two examples of how a long series of night sky brightness measurements can be represented. The 'jellyfish plot' (top) gets its name from its appearance when plotted with skies getting darker on the vertical axis. For each location on the plot in time (horizontal axis) and sky brightness (vertical axis), the color represents the number of measurements. Warmer colors mean more measurements. The 'arms' of the jellyfish show the varying length of the night through the year. The yellow band above center represents clear nights with no moonlight interference. The width of this band in the vertical direction is an indicator of night sky quality. The 'heatmap' (bottom) also shows a long series of measurements, but it puts the date across the horizontal axis and the time on the vertical axis. The plot curves like a sideways hourglass, reflecting the change in the length of the night throughout the year. The diagonal pink/white stripes represent the lunar cycle. The diagonal greenish stripe right of center is the brightest part of the Milky Way, seen progressively earlier in the evening as summer goes on. 'Knowledge is power'When measurements taken nightly over a long period are possible, we can properly speak of "monitoring" NSB. This allows searching for trends in the data that can show trouble is on the horizon. Increasing NSB can be due to a single local installation of outdoor lighting, the influence of a single large city, or the collective effect of many nearby towns. In turn, dark-sky advocates can use this information to influence decision making in and near light sources of concern.
In Meditationes Sacræ (1597), the English philosopher Francis Bacon famously wrote that "knowledge itself is power." In confronting any social or environmental problem like light pollution, our ability to create change depends on how much we know about it. Understanding the light of the night sky is the first step in confronting the problem of light pollution. Measuring that light moves us from understanding to assessment. Monitoring its evolution with time adds detail that moves us toward solution. Night sky brightness measurement and quality assessment are key components of dark-sky conservation. We guide clients toward understand the requirements and challenges of this work and how to get data of the best quality. Contact us today to find out how we can help. (And read our Nature Astronomy paper here.)
0 Comments
Read More
|
 RSS Feed
